Commitments Graph Coaching View
This graph is the same as the 13 Month Graph Component found on your MPDX Dashboard. It updates every 24-hours when donations are added by Donation Services.
Note: The MPDX Coaching view of the 13 Month Graph Component is slightly different from the Dashboard view in that clicking on the Monthly Giving Bar does not link to a report of all the gifts for that month. Sharing coaching access with someone does not give them access to any personal identifiable information of contacts.
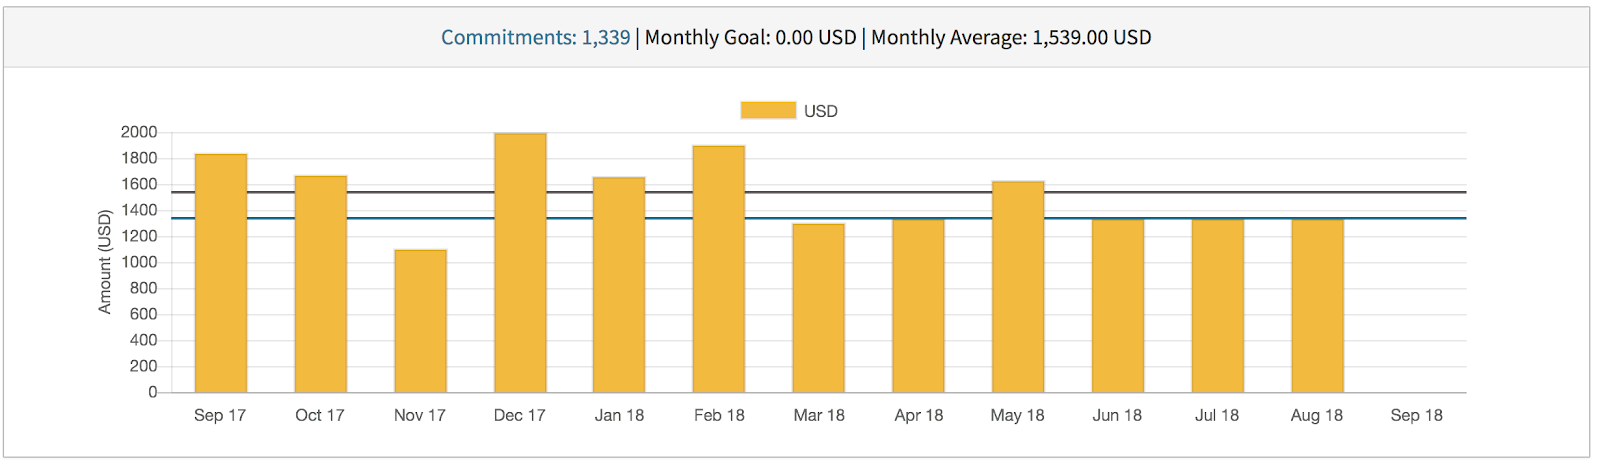
The MPDX Bar Graph gives you Monthly Totals, from the current month, for the fiscal year.
- Commitments, Monthly Goal, and Monthly Average numbers are displayed above the bar graph.
- Click on the Legend to view a specific currency type. You can check and uncheck which currency type(s) are visible.
- Hover your mouse over any Giving Activity Bar for total gifts given for that month.
- The Bar Graph displays Multiple Currencies and each currency is displayed in a different color.
- Within the bar graphs are colored lines representing Recurring Gift Goal (light blue), Monthly Average (black), and Commitments Made (dark blue).
